A Petals ESB container is composed of several internal components. Each one can be monitored and provides several metrics:
- the transporters:
- the local transporter:
- delivered messages
- the local transporter:
Each metric provides:
- a simple usage is based on a Cacti's data input method based on a Petals CLI command,
- a queried usage is based on a Cacti's data query invoking a Petals CLI command.
Monitoring the transporters
Monitoring the local transporter
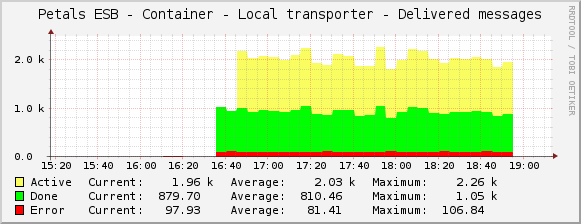
Delivered messages
The number of messages delivered by the local transporter can be graphed:
- by message exchange status using imply the metrics, see Creating a graph using a simple data:
- Script/Command of the data input method: petals_cli -h <petals_host> -n <petals_jmx_port> -u <petals_jmx_user> -p <petals_jmx_password> -c – monitoring -o local-transporter -f delivered-messages – -m
- Output fields of the script/command:
Name Description Type Active Number of delivered message with status 'Active' COUNTER Done Number of delivered message with status 'Done' COUNTER Error Number of delivered message with status 'Error' COUNTER
- by message exchange status and filtered for a dedicated endpoint, or a service, or an interface, see Creating a graph using a data query
The local transporter provides a metric about the delivered messages that it delivers. This metric can be used simply to get the delivered messages by message exchange status whatever the endpoint, the service and the interface:
Or, through a queried usage to get the delivered messages to a dedicated endpoint/service/interface, by message exchange status.